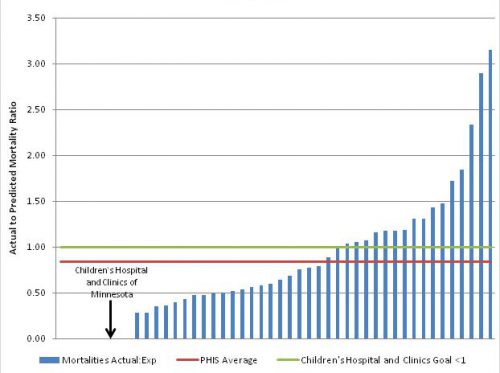
Actual to predicted mortality ratio – Hematology 2011-2013

Interpretation: The mortality ratio compares how many patients died (actual) in the hospital to how many were predicted to die given the severity of their illness. A ratio of less than 1.0 means fewer patients died while in the hospital than expected. Children’s performs better than its peers.
What we are doing to improve: All departments regularly review their procedures to identify potential ways to improve survival.
Data source: Children’s Hospital Association
Benchmark data: Average of 43 other children’s hospitals. The other children’s hospitals’ ratios are less than 1.0 because the expected number of deaths comes from a larger reference database. Click here for more details.
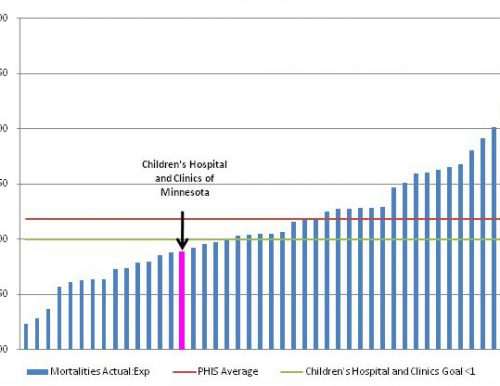
Actual to predicted mortality ratio – Oncology 2011-2013

Interpretation: The mortality ratio compares how many patients died (actual) to how many were predicted to die given the severity of their illness. A ratio of less than 1.0 means fewer patients died than expected. Fewer oncology patients than expected died in our hospital.
What we are doing to improve: All departments regularly review their procedures to identify potential ways to improve survival.
Data source: Pediatric Health Information System database sponsored by Child Health Corporation of America.
Benchmark data: Average of 43 other children’s hospitals. The other children’s hospitals’ ratios are less than 1.0 because the expected number of deaths comes from a larger reference database. Click here for more details.
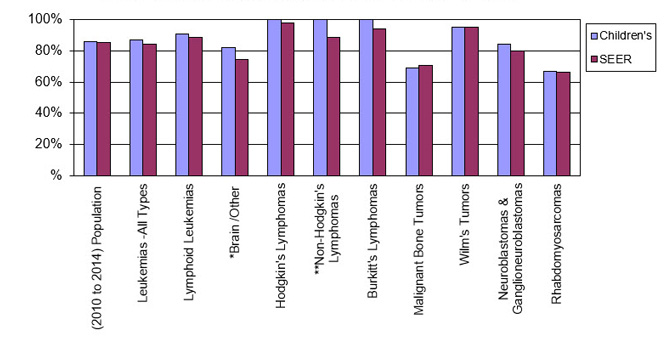
Five-year survival rates, ages 0-19 diagnosed between 2010-2014

Interpretation: Survival rates are reported in 5-year increments based on the date of diagnosis. Overall, Children’s survival rates for nearly all cancers compare favorably with the SEER average.
What we are doing to improve: All departments regularly review their procedures to identify potential ways to improve survival.
Data source: Children’s Cancer Registry.
Benchmark data: The Surveillance, Epidemiology, and End Results (SEER) Program of the National Cancer Institute publishes cancer survival data from 18 population-based cancer registries located throughout the United States.