Please note: this information was last updated in 2013 and may be out of date.

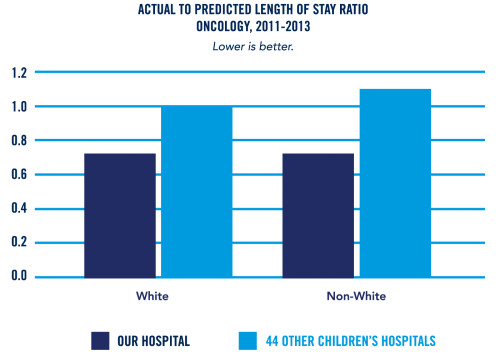
Interpretation: The length-of-stay ratio compares how long a patient stays in the hospital (actual) to how long they are predicted to stay given the severity of their illness. A ratio of < 1.0 means a patient’s length of stay was shorter than expected. The ratio between White and Non-White patients is the same, and lower than the average of other children’s hospitals.
What we are doing to improve: Improved discharge planning is the focus of an ongoing quality improvement project.
Data source: Children’s Hospital Association
Benchmark data: Average of 40 other children’s hospitals. The other children’s hospitals ratio is greater than 1.0 because the expected length of stay comes from a larger, national database. More details.

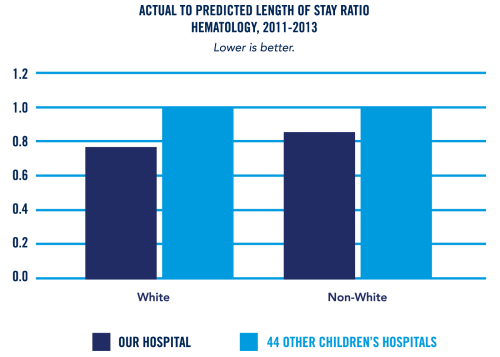
Interpretation: The length-of-stay ratio compares how long a patient stays in the hospital (actual) to how long they are predicted to stay given the severity of their illness. A ratio of < 1.0 means a patient’s length of stay was shorter than expected. The ratio between white and non-white patients is similar, and lower than the average of other children’s hospitals.
What we are doing to improve: Improved discharge planning is the focus of an ongoing quality improvement project.
Data sources: Pediatric Health Information System database sponsored by Child Health Corporation of America.
Benchmark data: Average of 41 other children’s hospitals. The other children’s hospitals ratio is greater than 1.0 because the expected length of stay comes from a larger, national database. More details.