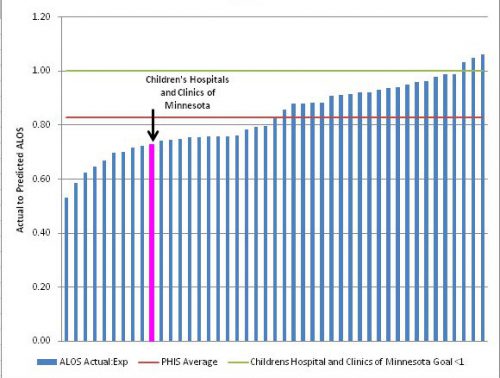
Actual to predicted average length of stay ratio – Hematology 2013

Interpretation: The length-of-stay ratio compares how long a patient stays in the hospital (actual) to how long they are predicted to stay given the severity of their illness. A ratio of less than 1.0 means a patient’s length of stay was shorter than expected. Children’s performs better than its peers on this outcome.
What we are doing to improve: Improved discharge planning is the focus of an ongoing quality improvement project.
Data source: Children’s Hospital Association
Benchmark data: Average of 41 other children’s hospitals. The other children’s hospitals’ ratios are greater than 1.0 because the expected length of stay comes from a larger, national database. Click here for more details.
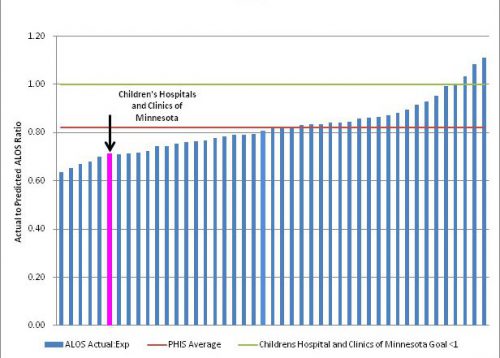
Actual to predicted average length of stay ratio – Oncology 2013

Interpretation: The length-of-stay ratio compares how long a patient stays in the hospital (actual) to how long they are predicted to stay given the severity of their illness. A ratio of less than 1.0 means a patient’s length of stay was shorter than expected. Children’s performs better than its peers on this outcome.
What we are doing to improve: Improved discharge planning is the focus of an ongoing quality improvement project.
Data source: Pediatric Health Information System database sponsored by Child Health Corporation of America.
Benchmark data: Average of 43 other children’s hospitals. The other children’s hospitals’ ratios are greater than 1.0 because the expected length of stay comes from a larger, national database. Click here for more details.
Readmission
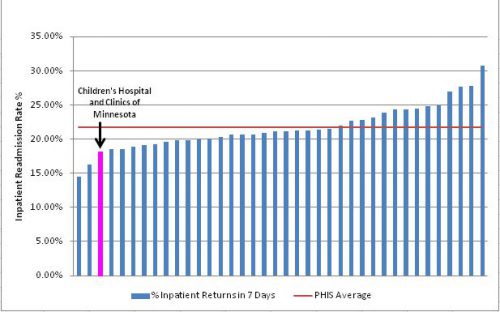
7 day readmission any condition – Hematology 2013

Interpretation: Readmission for any condition (within 7 days) may mean that patients are discharged too soon. Children’s is roughly the same as the PHIS average on this measure.
What we are doing to improve: Improved discharge planning is the focus of an ongoing quality improvement project.
Data source: Pediatric Health Information System database sponsored by Child Health Corporation of America.
Benchmark data: Average of 41 other children’s hospitals.
7 day readmission any condition – Oncology 2013

Interpretation: Readmission for any condition (within 7 days) may mean that patients are discharged too soon. This rate does not include patients who come back for chemotherapy. Children’s is below the PHIS average on this measure.
What we are doing to improve: Improved discharge planning is the focus of an ongoing quality improvement project.
Data source: Pediatric Health Information System database sponsored by Child Health Corporation of America.
Benchmark data: Average of 43 other children’s hospitals.