Patient and family satisfaction outcomes
We ask every patient’s family to tell us what they think
Every year, we survey hundreds of families to find out how we did. Using the NRC Real-time Patient Experience Survey — a survey used by many children’s hospitals nationwide — we track satisfaction scores for every unit in the hospital or clinic. We share the results with staff and work with our Family Advisory Council to find ways to create a more welcoming and satisfying environment for all patients and families.
Net Promoter Score
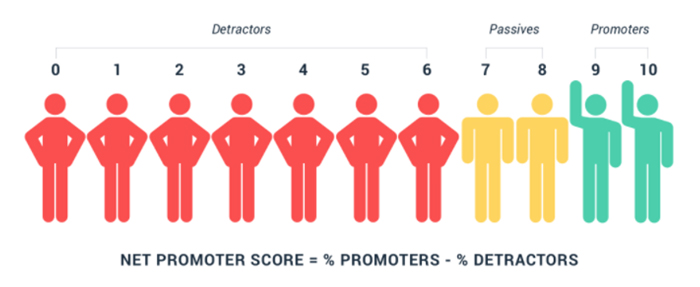
After a visit, families are asked to rate their willingness to recommend Children’s Minnesota to another family on a scale 0-10, with 10 being the best response (highly recommend). We then use those responses to calculate the Net Promoter Score, a metric that can be used to track customer loyalty to our system. Based on the response to the willingness to recommend question, each family can be categorized into one of three groups – promoters (9 or 10); passives (7 or 8) and detractors (0-6). Measuring the Net Promoter Score changes the focus from a satisfactory encounter to overall loyalty. This provides us with more information regarding the perception of our brand and image and how likely we are to retain relationships with our patients and families.
Image credit: NRC Health
This chart shows the Net Promoter Score
When reading the chart, higher is better.
