How To Read An Audiogram Test: The Basics
An audiogram is a chart used to plot out hearing sensitivity and visually display the results of an audiogram hearing test. The quietest sounds a person can hear—thresholds—are measured across a broad range of pitches.
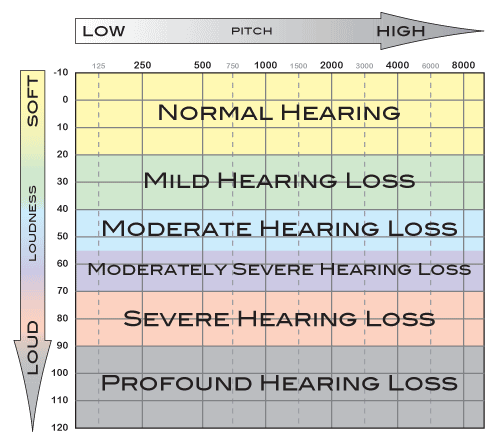
The numbers on the top of the audiogram represent pitch. When reading them from left to right, pitch changes from low to high (bass to treble).
The numbers running down the side of the audiogram represent loudness level. When reading from top to bottom, the loudness changes from soft to loud.
The symbols on an audiogram represent the quietest sounds which the child can detect. Where the symbols fall on the audiogram indicate the degree of hearing loss (how much hearing loss is present in each ear) as well as the type of hearing loss (conductive, sensorineural, or mixed). Once the audiogram is completed, your audiologist will explain to you in depth your child’s individual hearing sensitivity.
The following is a generic audiogram that displays pitch, loudness level, and the degrees of hearing loss.

Tympanometry
Tympanometry is a test of middle ear function, not hearing ability. Tympanometry measures the mobility of the eardrum and health of the middle ear space by introducing varying air pressure into the ear canal. Typically the child sits in a parent’s lap, a small rubber probe is inserted into the ear, and results are obtained within seconds. The results from tympanometry can help assess impacted earwax, middle ear fluid, eustachian tube dysfunction, eardrum perforations, and the status of pressure equalization (PE) tubes.